
Professional
Crawl paths
-
Last updated: March 31, 2025
-
Read time: 4 Minutes
By default, Burp Scanner uses an embedded Chromium browser to navigate around a target during the crawl phase of a scan. This enables it to act much as a skilled manual tester would, discovering dynamic content that a regular scanning engine might miss.
The Crawl paths tab shows the results of this process in real time, displaying the actions taken by Burp Scanner to reach each location discovered in the target site, and any issues found in those locations.
Accessing the Crawl paths view tab
You can access the Crawl paths view tab from two locations:
- To view combined path information for all regular, non-isolated scans in the current project, go to Target > Site map > Crawl paths view. Any new non-isolated scans that you run add to the information displayed in this tab.
- To view path information for an isolated scan, go to the Dashboard tab and select the scan from the Tasks list. In the main panel, go to the Target > Site map > Crawl paths view tab. This tab doesn't include information from any other scans. You only see this tab for scans that have the Run isolated scan setting selected.
More information
For information on running isolated web application scans, see Running a full crawl and audit.
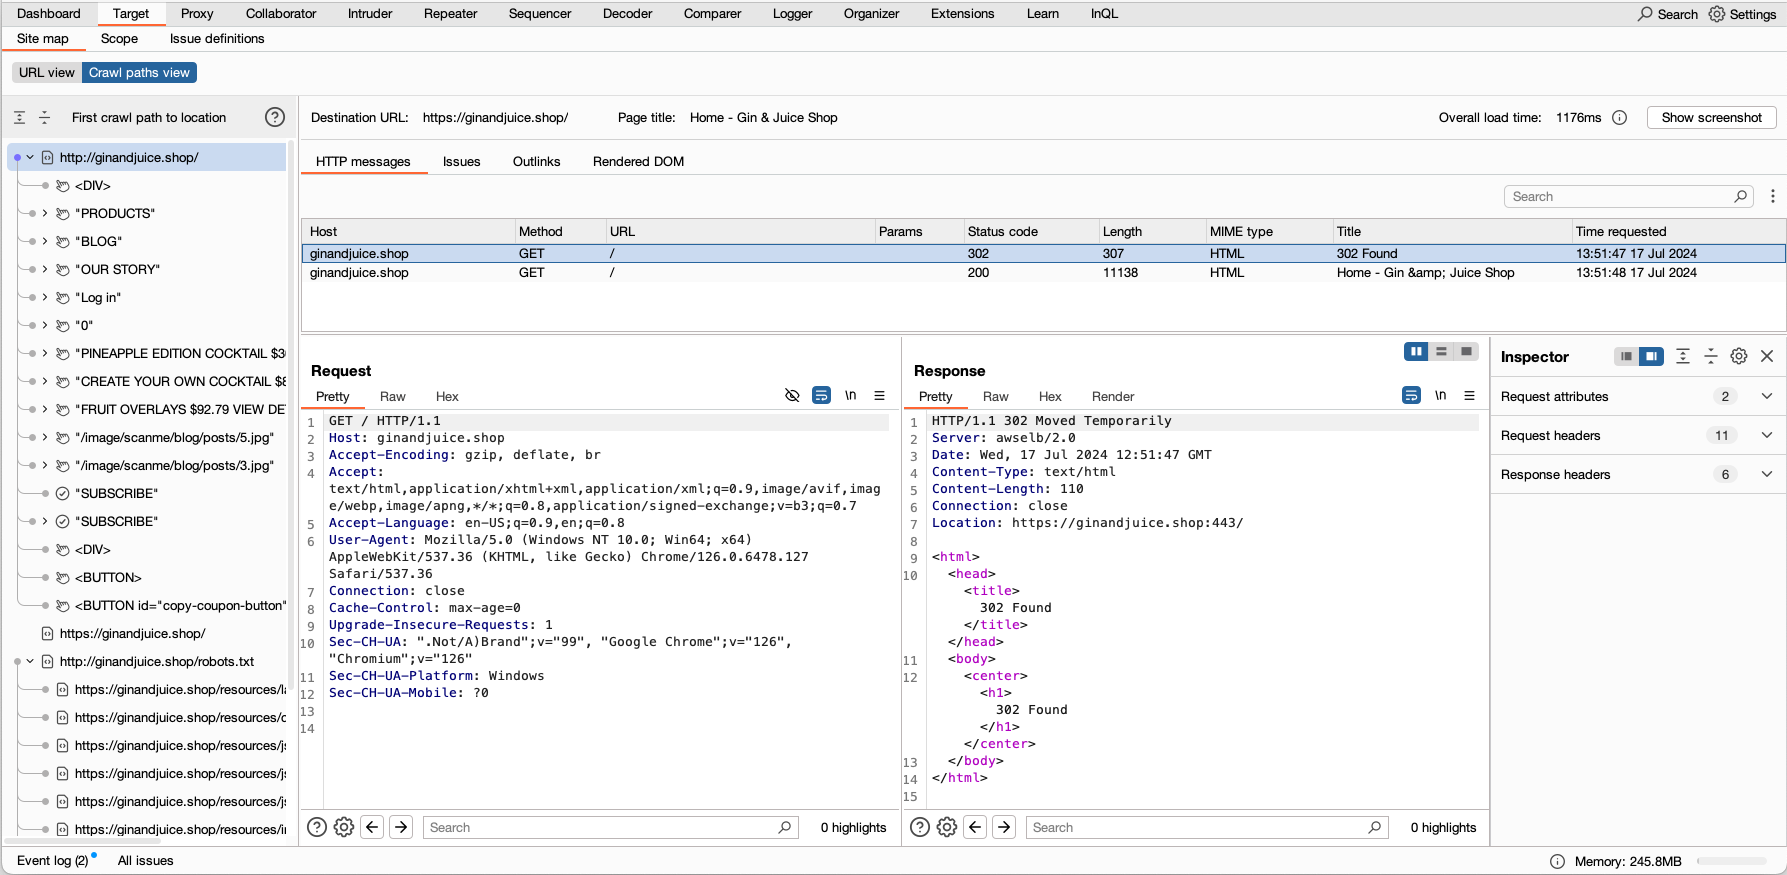
Viewing crawl paths
The First crawl path to location panel shows each location that Burp Scanner found during the crawl phase, and the paths it took to reach them. This panel only displays the initial path that was discovered to each location. It doesn't update if a shorter path is found later. The actions Burp Scanner takes during a crawl are represented by icons:
- Click: Simulated a user click on the specified element.
- Request page: Sent a request to retrieve the contents of the specified page.
- Follow redirect: Followed an HTTP redirect response to its new location to retrieve the intended contents or resource.
- Submit form: Submitted a form with predefined or random data to the intended server.
- Replay recorded login sequence: Replayed a recorded login sequence to attempt to gain access to a secure area of the target application.
- Run OpenAPI request: Sent an HTTP request to the specified OpenAPI endpoint.
- Invoke GraphQL operation: Ran a query or mutation to retrieve or modify data from a GraphQL API.
- Introspect GraphQL application: Ran an introspection query to retrieve details about the structure and types of the GraphQL API schema.
To view a screenshot of Burp's browser at any crawl location, select a node, then click Show screenshot.
Example crawl path
For example, suppose that Burp Scanner is crawling an online shop and finds that each product page has a "more information" link. The path to this link may be displayed as something like:
example-shop.net > Products > Example product > More information
Any additional actions performed by Burp Scanner from the Example product page (such as clicking any additional links or submitting a stock information form) would be displayed underneath the Example product node in the tree.
Viewing HTTP requests
To view further information on the HTTP requests and responses sent at a particular point, select a node from the First crawl path to location panel. The HTTP messages tab displays details of the messages that were sent to reach the selected location, including:
- Host
- Method
- URL
- Params
- Status code
- Length
- MIME type
- Title
- Time requested
Select a message to view the raw request and response in the tabs below.
All destination URLs include fragments. This makes it easier to understand what outcome a particular action leads to.
You can customize and sort the table contents. For more information, see Customizing Burp's tables.
Viewing issues
If the scan is configured to audit as well as crawl, the First crawl path to location panel also shows details of any issues discovered.
Where an issue is found, the panel displays an icon next to the relevant node in the tree. This enables you to see the path taken by Burp Scanner to discover the issue, helping you to understand how you can reproduce it if required.
Where a node has one or more children, it displays the icon of the most significant issue that can be found among its child nodes. For example, if a node's children have one high-severity issue and ten information-only issues, the parent node displays a high-severity issue icon.
To view further information on the issues discovered at a particular location, select a location from the First crawl path to location panel and click the Issues tab. This tab contains a list of the issues found at that location in this scan. Select an issue to view the specific requests and resources that identified it, as well as a tab containing advisory information.
Viewing outlinks
To view details of all the possible navigation actions that the crawler was able to take from a given location in the crawl path, select the Outlinks tab. Actions may include, for example, clicking links, submitting forms, and making requests.
For each action the crawler completed from the selected location, further details are displayed, including the:
- Destination URL - The URL that the crawler navigates to.
- Title - The title of the destination page, if there is one present.
- Issues - Any issues found on the destination page. These are only displayed if the scan is configured to audit as well as crawl.
- Requests - The number of requests made as a result of taking the action.
- Time visited - The time at which the crawler took the action.
More information
Crawling - Gives a detailed overview of how Burp Scanner approaches the crawl phase of the scan.